Building an Automated Fragrance Trend Tracker
Published on | Analytics & Tracking • Hobby Project • Automation
Outside of digital analytics, I am a fragrance collector. I love tracking new releases, discovering scents, and seeing which specific scent notes are suddenly capturing everyone's attention online.
However, the perfume industry is notoriously secretive with its data. As a curious person, I wanted to know what was trending right now, not six months ago in an outdated market report. I realized that the best indicator of real-time consumer interest is search behavior. If a specific note like "marshmallow creme" or a niche Arabian perfume starts going viral on TikTok, search intent spikes almost instantly.
So, I decided to turn my hobby into a small data engineering project and build my own Market Intelligence Dashboard.
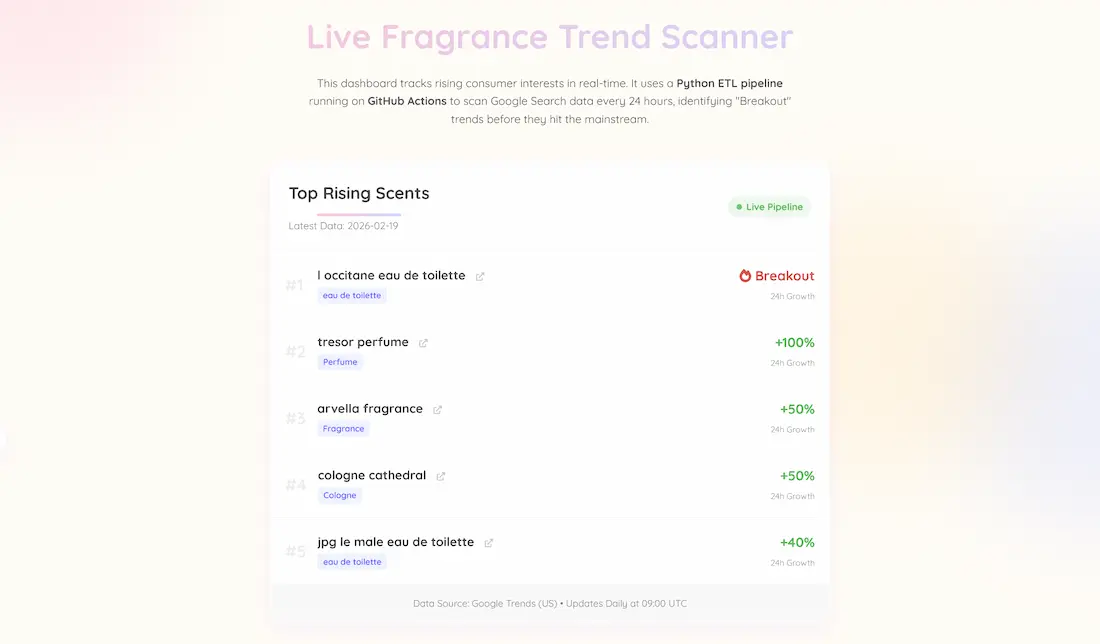
The Goal: A Self-Updating Trend Scanner
I didn't want a static analysis that required me to manually pull reports. I wanted a fully automated pipeline that would wake up every day, scan the internet for "breakout" fragrance terms, and update a live dashboard on my portfolio without me lifting a finger.
The Tech Stack
To build this "headless" data architecture, I used:
- Python & Pytrends: I have a script to query Google Trends data, specifically looking for related queries classified as "breakout" (meaning search volume has surged by over 5000% recently). It scans broad terms like "perfume," "cologne," etc. to cast a wide net.
- GitHub Actions (ETL Automation): This is the engine. I set up a YAML workflow that spins up a virtual environment every 24 hours at 09:00 UTC, installs the necessary Python libraries, runs my script to fetch fresh data, and commits the results directly to a CSV file right in my repository.
- JavaScript & HTML (Frontend): My portfolio page fetches that raw CSV data dynamically using PapaParse and renders it into an easy-to-read "Live Trending Now" leaderboard.
The Result
It might be a small hobby project, but seeing real-time data flow automatically is quite satisfying. The scanner has already proven its worth by picking up on new viral trends for me to check out.
It was a fun learning experience to bridge the gap between frontend tracking and backend data pipeline engineering!